
This guide opens a practical window into CROSH, the ChromeOS Developer Shell that gives direct access to system-level controls. Quick and useful, it helps with diagnostics, battery checks, network tests, and simple troubleshooting without extra apps.
- What is Crosh and how to open the ChromeOS Developer Shell
- 25 Crosh Terminal Commands All Chromebook Users Should Know
- help and help_advanced: discover available crosh command options
- help <command>: get syntax and usage details
- exit and Ctrl + C: end a session or stop a running process
- Network diagnostics and connectivity tools
- System, processes, and performance at a glance
- Battery, power, and Wi‑Fi power saver controls
- Memory and storage health checks
- memory_test: verify RAM integrity
- meminfo: detailed memory snapshot
- storage_status and storage_test_1: drive checks
- tpm_status: security module details
- Developer Mode essentials: shell and advanced tracing
- Bluetooth and input devices troubleshooting
- Cellular, modem, and APN management
- SSH, Linux container, and remote workflows
- Updates, rollbacks, and channels for testing ChromeOS
- Conclusion
- FAQ
- What is the Crosh shell and how do I open it?
- When should I use crosh vs. ChromeOS Settings?
- How do I discover available crosh commands?
- How can I stop a running command or exit crosh?
- How do I test network latency and connectivity?
- Can I perform DNS lookups from crosh?
- How do I check my Chromebook’s IP addresses?
- Is there a task manager equivalent in crosh?
- How can I check system uptime and session length?
- What crosh tools help with routing and logs?
- How do I test battery health and discharge rate?
- Can I control Wi‑Fi power saving from crosh?
- What commands check memory and storage health?
- Where can I find TPM details from crosh?
- How do I access a full shell in Developer Mode?
- Which commands help with advanced tracing and packet capture?
- How do I troubleshoot Bluetooth and input devices?
- What crosh options manage cellular modems and APNs?
- How do I use SSH and manage the Linux container from crosh?
- Can I switch ChromeOS channels or roll back via crosh?
- How do I manage peer‑to‑peer updates and show peers?
- Where can I get help if a command fails or returns errors?
To get started, press Ctrl + Alt + T to launch the built-in shell. From there, basic help and exit options keep things safe while commands like ping and network_diag let you trace connectivity problems fast.
We’ll list tools for monitoring CPU and memory, checking storage health, and running a battery_test to see power performance over time. Advanced readers will also find notes on SSH, Linux containers, and Developer Mode utilities.
In short: this compact list shows key commands, when to use them, and how to stay safe during troubleshooting so you can get accurate system information in less time.
What is Crosh and how to open the ChromeOS Developer Shell
A quick key combo — Ctrl + Alt + T — launches the shell as a Chrome browser tab. It gives fast access to system-level tools without leaving the browser. Think of it as a compact diagnostic console.
You do not need developer mode just to open this terminal or run many basic commands. Some advanced features like shell, systrace, and packet_capture require developer mode for safety.
Use the shell when you want deeper diagnostics or precise command-driven results. For everyday preferences, stick with Settings to avoid unnecessary risk.
Quick tips
- Press Ctrl + C to stop a running process without closing the tab.
- Type exit to close the session cleanly.
- The interface stays minimal so you can run a command and get results fast.
| Action | What it does | When to use |
|---|---|---|
| Ctrl + Alt + T | Open the built-in shell in a Chrome tab | Quick diagnostics or fast checks |
| Ctrl + C | Interrupt a running process | If a command hangs or runs long |
| exit | Close the session | When finished with the shell |
25 Crosh Terminal Commands All Chromebook Users Should Know
Start smart: type help to see the core list, or run help_advanced to reveal a broader set of options in the crosh terminal. These discovery tools work without Developer Mode and save time when you need the right command fast.
help and help_advanced: discover available crosh command options
Type help first to display common entries. Use help_advanced when you want deeper diagnostic tools and power-user features.
help <command>: get syntax and usage details
If you need exact syntax, run help <command>. The output shows required arguments, optional flags, and example usage so you avoid guessing the right number or format.
exit and Ctrl + C: end a session or stop a running process
Type exit to leave the session cleanly and avoid lingering processes. To stop a long-running test like ping or memory_test, press Ctrl + C to interrupt without closing the tab.
- Start every session with help to see core commands and quick tips.
- Use help <command> for syntax so you don’t waste time on trial runs.
- If output streams too long, press Ctrl + C to halt it immediately.
- Type exit when you finish to keep the session tidy.
- These basics help whether you check network latency for a few seconds or inspect memory details.
| Action | What it shows | When to use |
|---|---|---|
| help | List of common commands and brief descriptions | At session start to find tools quickly |
| help_advanced | Extended crosh command set for debugging | When you need deeper diagnostics or options |
| help <command> | Syntax, flags, and example usage | Before running a new command to avoid errors |
| Ctrl + C / exit | Interrupt processes or close the terminal cleanly | Stop long-running processes; end the session |
Network diagnostics and connectivity tools
Run a quick ping to confirm the device can reach a remote host. For example, run ping google.com to measure latency and spot packet loss. A brief ping test helps determine if slow browsing or call quality stems from reachability or high delay.
Use network_diag when you need a full connectivity snapshot. This crosh command collects interfaces, signal conditions, DNS results, and other details. On some devices the report can save as text, which is handy when sharing information with support.
Trace and DNS checks
tracepath <host> shows hop-by-hop routing to the destination. It highlights where packets slow down so you can spot local versus upstream bottlenecks.
The dns tool queries name resolution from the shell. Use it to confirm whether a lookup failure is caused by DNS or something beyond your resolver.
- ipaddrs lists active interface addresses. Add -4 or -6 to focus on IPv4 or IPv6 and verify subnet details.
- Combine tools: check addresses with ipaddrs, test reachability with ping, then locate delays with tracepath for a full picture.
- When documenting a problem, copy outputs from network_diag and ping. That information speeds up support and removes guesswork.
| Action | What it shows | When to use |
|---|---|---|
| ping <domain> | Reachability, latency, packet loss | Quick connection test |
| network_diag | Comprehensive network diagnostics report | When you need a shareable report |
| tracepath, dns, ipaddrs | Route, name resolution, interface info | Deeper troubleshooting and verification |
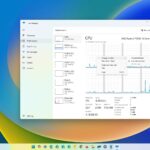
System, processes, and performance at a glance
Use a low-level task viewer to spot heavy processes and resource drains fast. These quick checks give a concise snapshot of system health so you can act without digging through settings.
top: a deeper task manager
top opens a richer task manager than the browser UI. It lists background processes, CPU points, and memory use so you can find runaway tasks quickly.
Run it when apps feel sluggish. You’ll see process IDs and percent CPU so you can decide to close tabs or end a task.
uptime: runtime and active sessions
uptime shows how long the device has been running and how many sessions are active. Long run times can explain slowdowns after extended use.
route and syslog: routing and logging
route prints routing tables to confirm which gateway and interface handle outgoing traffic. This helps after VPN or Wi‑Fi changes.
Use syslog <message> to append notes into the log. That makes it easier to match your actions with recorded events in the operating system.
- Run top first to find resource-hungry processes.
- Check uptime when performance drifts after long sessions.
- Use route for network path verification.
- Append context with syslog <message> when reproducing issues.
| Action | What it shows | When to use |
|---|---|---|
| top | Active processes, CPU %, memory usage | Identify heavy tasks and troubleshoot slow apps |
| uptime | System run time and logged sessions | Check for performance drift after long runs |
| route | Routing table and default gateway | Verify network paths after VPN or Wi‑Fi changes |
| syslog <message> | Custom log entry in system logs | Mark steps when reproducing an issue for later review |
Battery, power, and Wi‑Fi power saver controls
Check battery behavior with a short, focused test that reports discharge and estimated runtime. These quick checks give clear numbers so you can act, not guess.
battery_test <seconds>
Run battery_test <seconds> (for example, battery_test 10) to sample discharge rate, remaining time, and overall battery health. Try 10–30 seconds for a quick snapshot that avoids long waits.
Repeat tests at different times to let know if background apps or a weak signal cause faster drain. Compare results while charging and on battery to spot adapter or cable problems.
wifi_power_save enable | disable
The wifi_power_save toggle controls Wi‑Fi behavior during sleep. Disable it to keep connections alive for syncs or remote tasks. Re-enable to extend runtime when you don’t need constant updates.
Note: this setting may revert after a full restart, so recheck if persistent behavior matters.
- Pair battery_test with top to match discharge numbers with active processes.
- If health looks low, lower brightness, close heavy tabs, or plan a battery replacement.
| Action | What it reports | When to use |
|---|---|---|
| battery_test <seconds> | Discharge rate, estimated remaining time, health indicator | Quick checks and comparisons (10–30 seconds) |
| wifi_power_save enable | Allows Wi‑Fi to sleep to save power | Maximize battery life when idle or away |
| wifi_power_save disable | Keeps Wi‑Fi active during sleep | When you need persistent connectivity |
| Repeat tests + top | Correlate runtime with active processes | Diagnose background drains or adapter issues |
Memory and storage health checks
If your device freezes or behaves oddly, a short memory and drive health check can point to the cause. These diagnostics provide concrete numbers so you can decide whether to reboot, free space, or seek repairs.
memory_test: verify RAM integrity
memory_test runs checks on available RAM to surface failures quickly. Use it when you see random crashes or unexpected reboots. A failed result is a clear signal to back up important data and plan service.
meminfo: detailed memory snapshot
meminfo shows total, free, cached, and swap usage. Consult this output to spot memory pressure before performance dips. It helps you match a high number in use with running apps or background tasks.
storage_status and storage_test_1: drive checks
storage_status reports vendor info, SMART state, and error logs so you can judge drive health. For a short read/write verification, run storage_test_1 and watch for anomalies or errors in the output.
tpm_status: security module details
tpm_status prints the Trusted Platform Module state. Use it when sign-in or enterprise checks fail, or when you need to confirm the security type and readiness.
When documenting an issue, copy each output into notes. That data makes support faster and shows trends over time. If any test reports failure, back up files immediately and schedule hardware service.
- Use memory_test to rule out RAM faults.
- Check meminfo for free and cached amounts.
- Run storage_status and storage_test_1 for drive health.
- Verify tpm_status for security module issues.
| Check | What it shows | When to run |
|---|---|---|
| memory_test | RAM integrity and failures | After instability or crashes |
| meminfo | Total, free, cached, swap | When memory pressure appears |
| storage_status / storage_test_1 | SMART, vendor, errors, read/write test | On slow I/O or file errors |
| tpm_status | TPM state and details | Sign-in or enterprise security checks |
Developer Mode essentials: shell and advanced tracing
Enabling developer mode unlocks deeper system tools for targeted troubleshooting. It grants access to a full shell and advanced trace utilities that go beyond the normal crosh experience.
The shell command opens a Bash environment where you can run scripts, install extra tools, and use low‑level utilities. This is for experienced people who need more control than the built‑in terminal offers.
systrace and packet_capture
systrace records detailed system timing and performance traces. Use it to diagnose jank, slow startups, or intermittent stalls by collecting only the time ranges you need.
packet_capture logs network packets for protocol analysis and deep debugging. When ping and network_diag don’t explain a problem, packet logs reveal packet loss, retransmits, or malformed traffic.
- Enable developer mode only when required; it lowers some platform protections.
- Keep traces short and focused to limit battery drain and privacy exposure.
- Combine systrace and packet_capture with outputs from top and network_diag to map CPU, I/O, and network behavior together.
- Document steps and save outputs so you can reproduce results and revert changes safely.
For a practical primer on using these tools and safe workflows, see this guide on mastering the developer shell.
Bluetooth and input devices troubleshooting
Start by opening a Bluetooth console to inspect nearby peripherals and their signal details.
bt_console opens a live interface to scan, pair, block, and view device information. Inside the console, type help to list available subcommands and quick usage notes. Use it to verify a weak connection, retry pairing, or remove a stale profile before testing audio or mice again.
evtest: monitor hardware events
evtest lists input devices and asks you to pick a device number to monitor events. Select the right device and press keys, tap the touchpad, or use a stylus to see raw input events appear in the output.
- Launch bt_console to scan and pair nearby devices and to inspect signal strength.
- Inside bt_console, type help to reveal commands for blocking or unblocking peripherals.
- Run evtest, choose the device number, and watch events to confirm hardware generates input.
- If evtest shows nothing, the issue likely sits with the device or driver; if it does, check app settings.
| Tool | What it does | When to use |
|---|---|---|
| bt_console | Scan, pair, view details | Audio dropouts or disconnects |
| evtest | Monitor raw input events | Key, touchpad, or pen troubleshooting |
| help (inside bt_console) | List subcommands | Find block/unblock/remove options |
Cellular, modem, and APN management
Inspect the modem status first so you know what the hardware reports about activation, eSIM, and signal. modem help lists subcommands for status, activation, connecting, firmware, and factory reset. Use it to find the right action without guessing.
If you cannot reach the internet over mobile data, update the APN. Run set_apn to enter the carrier’s APN values. One typo can block access or cause roaming, so double-check entries.
PPP and update control
Some carriers need PPP credentials. Use set_cellular_ppp to add a username and password where supported. Then test the connection and watch for authentication errors.
To control costs, toggle OS updates over cellular with update_over_cellular enable|disable. Keep it disabled on limited plans and enable only when needed for urgent fixes.
- Start with modem help for the full list of modem subcommands.
- Use set_apn to fix carrier routing problems.
- Apply set_cellular_ppp for legacy PPP setups.
- Toggle update_over_cellular to manage update data use.
- Document working APN and PPP values for quick reconfiguration of other devices.
| Action | What it does | When to use |
|---|---|---|
| modem help | Shows status, activation, eSIM, firmware, reset | Start here to see available modem subcommands |
| set_apn <values> | Configures carrier APN for network routing | When mobile data fails or after a carrier change |
| set_cellular_ppp <user> <pass> | Sets PPP credentials for legacy connections | For carriers that require PPP authentication |
| update_over_cellular enable|disable | Allow or block OS updates over mobile data | Control bandwidth and billing on limited plans |
SSH, Linux container, and remote workflows
Secure remote access and a local Linux VM expand what you can do from a lightweight device. Use these tools to run shells, edit code, and manage systems without switching hardware.
ssh and ssh_forget_host
Use ssh to open a secure session. Provide the user, host, and port to match your server setup (for example: ssh user@host -p 2222).
If a server key changes or an entry becomes stale, run ssh_forget_host to remove the saved host and clear authentication warnings.
vmc start termina / vmc stop termina
vmc start termina boots the Crostini VM so Linux apps run. When apps hang or you want to save power, use vmc stop termina to shut the container down cleanly.
Restarting the VM is a handy task when updating packages or freeing memory after heavy tasks.
set_wake_on_lan true|false
Toggle Wake-on-LAN with set_wake_on_lan true to allow magic packets to power on supported Ethernet hardware. Set it false when you do not need remote wake abilities.
- Keep SSH keys and known hosts organized to speed logins and reduce errors.
- Standardize host names and ports when juggling multiple systems.
- Combine VM control with SSH for a smooth remote development workflow across different operating systems.
| Action | What it does | When to use |
|---|---|---|
| ssh user@host -p port | Open secure shell to a server | Remote admin and development tasks |
| ssh_forget_host <host> | Remove stored host key | Resolve changed-key warnings |
| vmc start/stop termina | Start or stop the Linux container | Run Linux apps; save battery or recover from hangs |
Updates, rollbacks, and channels for testing ChromeOS
Control over updates helps you balance stability and early access. Use these tools when you need to recover from a bad release or preview cutting‑edge features for testing.
rollback
rollback reverts the device to the prior ChromeOS version. It can fix issues introduced by a recent update.
Warning: rollback triggers a Powerwash (factory reset). Back up files first and allow extra time for re‑sign‑in and app provisioning.
live_in_a_coal_mine
live_in_a_coal_mine switches your device to the canary channel. This option is for developers who want the newest builds fast.
It requires Developer Mode and carries higher risk of bugs. Consider testing on a secondary device or separate profile before you switch canary on a main machine.
p2p_update enable|disable and p2p_update –show-peers
Peer‑to‑peer updates reduce duplicated downloads on a local network. Use p2p_update enable to allow sharing and p2p_update disable to block it.
Run p2p_update –show-peers to list current peers and audit how updates flow across your network. This helps manage bandwidth and data use in classrooms or offices.
- If an update causes instability, rollback will restore the prior version but erase local data.
- Canary builds are great for rapid diagnostics and fixes, yet they may introduce regressions; keep a recovery plan.
- Test new channels on secondary devices first and document behavior and time needed to recover.
For a practical walkthrough of crosh usage and related commands, see this chrome OS crosh guide: chrome OS crosh guide.
Conclusion
Conclusion,
When problems arise, a few targeted checks reveal useful information fast. This short list covers core steps: launch with Ctrl + Alt + T, type help or help_advanced, and use Ctrl + C to stop a long task.
Use ping, network_diag, top, battery_test, memory_test, and storage_status for quick diagnostics. As skills grow, add ssh, vmc, modem help, and p2p_update to your toolbox.
Keep this reference handy to speed troubleshooting and share clear outputs when you need help. If something needs escalation, these crosh command results let support let know what’s already been checked.
FAQ
What is the Crosh shell and how do I open it?
Crosh is a lightweight command shell built into ChromeOS for diagnostics and basic system tasks. To open it, press Ctrl + Alt + T from the Chrome browser. That launches the crosh prompt where you can type commands for network tests, device checks, and other tools.
When should I use crosh vs. ChromeOS Settings?
Use Settings for routine configuration like Wi‑Fi, users, and display options. Use crosh when you need diagnostics, network tests (ping, tracepath), low‑level info (meminfo, uptime), or developer tools unavailable in Settings. Avoid crosh if you aren’t comfortable with technical output or if a Settings toggle is sufficient.
How do I discover available crosh commands?
At the crosh prompt type help to list basic commands. For more advanced options, use help_advanced. To get usage details for a specific entry, run help <command>.
How can I stop a running command or exit crosh?
Press Ctrl + C to interrupt many running tasks. Type exit to close the crosh session and return to the browser tab.
How do I test network latency and connectivity?
Use ping <domain> for a quick latency check and packet loss info. For a full network report, run network_diag. To see the route path to a host, use tracepath <host>.
Can I perform DNS lookups from crosh?
Yes. Use the dns command in crosh to perform DNS queries and verify name resolution without leaving the shell.
How do I check my Chromebook’s IP addresses?
Run ipaddrs to see all addresses. Append -4 or -6 to view only IPv4 or IPv6 info, respectively.
Is there a task manager equivalent in crosh?
The top command shows running processes and CPU usage at a low level. For a GUI, use the ChromeOS Task Manager from the browser menu, but top gives more detailed OS‑level data.
How can I check system uptime and session length?
Use the uptime command. It returns how long the system has run and current load averages.
What crosh tools help with routing and logs?
Use route to view routing tables. For system messages and diagnostic logs, syslog or system log viewers in crosh can provide details useful for troubleshooting.
How do I test battery health and discharge rate?
Run battery_test <seconds> to sample battery behavior over a set period. The output shows discharge rate, estimated runtime, and health indicators.
Can I control Wi‑Fi power saving from crosh?
Yes. Use wifi_power_save enable or wifi_power_save disable to toggle Wi‑Fi power saver behavior, which affects battery and connectivity during sleep.
What commands check memory and storage health?
Use memory_test to verify RAM integrity and meminfo for detailed memory stats. For storage, run storage_status or storage_test_1 to perform drive health checks.
Where can I find TPM details from crosh?
The tpm_status command reports Trusted Platform Module state and version info relevant to security features and verified boot.
How do I access a full shell in Developer Mode?
In Developer Mode you can run shell from crosh to access a full Bash shell. This provides broader system control but carries risk—Developer Mode disables some security features and may require a Powerwash.
Which commands help with advanced tracing and packet capture?
Use systrace to collect system trace data and packet_capture to log network packets for deeper debugging. These are intended for advanced troubleshooting and developer use.
How do I troubleshoot Bluetooth and input devices?
Use bt_console to scan, pair, and debug Bluetooth devices. For input hardware like keyboards and touchpads, run evtest to monitor events and verify signals.
What crosh options manage cellular modems and APNs?
Enter modem help to list modem-related commands for activating or resetting. Use set_apn and set_cellular_ppp to configure carrier APN or PPP settings, and update_over_cellular enable/disable to control OS update behavior on mobile data.
How do I use SSH and manage the Linux container from crosh?
Use ssh to connect to remote hosts and ssh_forget_host to remove known hosts. Manage the Linux container with vmc start termina and vmc stop termina. You can also toggle Wake‑on‑LAN with set_wake_on_lan true or false where supported.
Can I switch ChromeOS channels or roll back via crosh?
Advanced channel controls exist but often require Developer Mode. The rollback command can revert to a previous OS version but typically triggers a Powerwash. The experimental live_in_a_coal_mine command is used to switch to the Canary channel in Developer Mode; use with caution.
How do I manage peer‑to‑peer updates and show peers?
Use p2p_update enable or p2p_update disable to toggle peer updates. To view current peers, run p2p_update –show-peers. These affect bandwidth and update delivery methods.
Where can I get help if a command fails or returns errors?
Start with help <command> to confirm syntax. Check system logs with syslog or network outputs like network_diag. If needed, consult official Google support pages or Chromebook help forums with command output handy for faster troubleshooting.