
Quick guide: this short intro shows the fastest way to get a feel for your PC’s performance. The classic visual panel was removed years ago, but the underlying system tool still works.
- What the Windows Experience Index Measures and Why It Still Matters
- Step-by-Step: How to Check Your Windows Experience Score on Windows 10
- Run WinSAT from Command Prompt
- Use PowerShell for a cleaner output
- View via Performance Monitor and raw XML files
- Use a Friendly Interface: Third-Party Tools That Restore a Visual WEI
- Make Sense of Your WEI: Interpreting Scores and Spotting Bottlenecks
- Beyond WEI: Alternatives for Deeper System Assessment
- SiSoftware Sandra for detailed benchmarking and comparisons
- UserBenchmark to compare your hardware with similar systems
- Conclusion
- FAQ
- How do I run WinSAT from Command Prompt to generate the WEI?
- Can I get a cleaner WEI output using PowerShell?
- Where are the WEI XML results stored?
- How can I view scores with Performance Monitor or System Diagnostics?
- Are there third-party tools that restore the visual WEI interface?
- What does the base score represent and how is it calculated?
- How should I interpret individual subscores for CPU, RAM, and disk?
- What do the numeric score ranges mean for everyday use?
- How do I spot and fix bottlenecks that lower the base score?
- Are there alternatives to WEI for deeper benchmarking?
- Will running these assessments harm my system?
What you’ll learn: how to run the winsat formal command, where XML results are saved (C:WindowsPerformanceWinSATDataStore), and how to pull a clean readout with Get-CimInstance Win32_WinSat in Windows PowerShell.
We also point out the Performance Monitor path for a full report and name a couple of visual tools that restore an easy index display. The base score reflects the weakest hardware part, so it helps spot upgrades that matter.
For step-by-step details and a compact walkthrough, check the guide that covers commands, data files, and quick tips for accurate results.
What the Windows Experience Index Measures and Why It Still Matters
Use this simple index to spot the single component that drags overall performance down. The windows experience index rates five key areas of your system so you can see which hardware piece matters most for daily tasks.
Quick facts: ratings run from 1.0 to 9.9 and include the processor (CPU), memory (RAM), desktop graphics, 3D gaming graphics, and the primary disk. The overall base score equals the lowest subscore, not an average, so one weak part defines the whole result.
Understanding subscores
- The five component areas make it easy to find bottlenecks in CPU, memory bandwidth, graphics pipeline, or disk throughput.
- Microsoft’s historical guidance links ranges to real use: around 2 for basic tasks, near 3 for richer UI, and 4+ for heavier graphics work.
- Although the Control Panel view was removed in windows 8.1, the underlying winsat tests and index remain useful in modern releases.
Bottom line: treat the experience index as a quick baseline. Use subscores to guide upgrades—add RAM, swap to an SSD, or upgrade the graphics card—depending on which number is lowest.
Step-by-Step: How to Check Your Windows Experience Score on Windows 10
Quick start: open an elevated Command Prompt and run winsat formal to kick off a full system assessment. The test checks CPU, memory throughput, graphics rendering, gaming graphics, and disk I/O. Expect the run to take a few minutes and the fans to ramp up.
On laptops, plug into AC power first. The assessment refuses to run on battery to avoid throttled results.
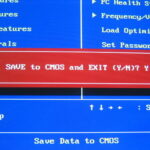
Run WinSAT from Command Prompt
Search for Command Prompt, right‑click and choose Run as administrator. Enter the command winsat formal. Do not run heavy apps while the tool executes; let it finish for accurate data.
Use PowerShell for a cleaner output
Open Windows PowerShell as admin and run Get-CimInstance Win32_WinSat. Look for the WinSPRLevel field to see the base index. This gives a tidy summary of subscores.
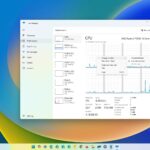
View via Performance Monitor and raw XML files
In Performance Monitor, go to Data Collector Sets > System > System Diagnostics, start the collector, then open Report > System Diagnostics > [computer name] and expand Hardware Configuration > Desktop Rating.
- For raw data, browse to C:WindowsPerformanceWinSATDataStore and open the latest “Formal.Assessment (Recent).WinSAT.xml”.
- If a test fails, update drivers, close apps, and rerun the assessment for stable results.
- Record your wei score before and after hardware upgrades to confirm improvements.
Use a Friendly Interface: Third-Party Tools That Restore a Visual WEI
Don’t feel like parsing XML? Several small utilities wrap the built‑in tests into a readable interface. They show subscores, let you rerun assessments, and make sharing quick.
ChrisPC Win Experience Index
What it does: restores the classic panel for modern releases and runs tests with one click. It was tested across many builds, from recent releases back to older updates.
The app is free for non‑commercial use and supports exporting results as a JPEG or plain text. If the underlying test fails, ChrisPC’s More details view helps pinpoint driver or storage issues.
Winaero WEI Tool
This lightweight tool surfaces the index fast and includes a built‑in screenshot option. It’s ideal when you want a quick image or a one‑page readout to document upgrades.
- Quick tip: visual tools read the same underlying data, so they match official results — they only change how you view them.
- Use these interfaces to compare systems, document upgrades, or share a compact results file with friends.
Make Sense of Your WEI: Interpreting Scores and Spotting Bottlenecks
Start by reading the base number; it points to the single component that most limits overall responsiveness.
What each subscore means:
CPU and processor
These numbers reflect raw compute power. A low value shows in slow compiling, long exports, or sluggish spreadsheets.
Memory and RAM
Memory ratings reveal bandwidth and latency. Low memory scores cause lag when multitasking or editing large files.
Graphics and gaming graphics
These measure desktop rendering and 3D ability. Low graphics values reduce UI smoothness and game frame rates.
Disk and storage
Disk results track read/write speed. Older hard drives often drag the base score down—upgrading to an SSD is the fastest way to boost real-world speed.
Use ranges to set expectations:
| Range | What it handles | Likely bottleneck | Quick fix |
|---|---|---|---|
| 1.0–3.9 | Basic tasks only (web browsing, light office) | Old disk or weak CPU | Install SSD; check drivers |
| 4.0–5.9 | General productivity and media | Limited RAM or older GPU | Add RAM; modest GPU upgrade |
| 6.0–9.9 | Smooth apps, light to heavy creative work | Fine-tune cooling, update drivers | Higher-end SSD, GPU, or faster RAM |
Quick troubleshooting: if the base score is low, focus on that subscore first. An SSD addresses most storage bottlenecks and usually gives the biggest visible boost across everyday tasks like launching apps and web browsing.
Beyond WEI: Alternatives for Deeper System Assessment
If a single index leaves questions, third‑party benchmarks give the broader view. These apps test parts individually, compare results to large databases, and suggest upgrade paths.
SiSoftware Sandra for detailed benchmarking and comparisons
SiSoftware Sandra is a granular assessment tool. It runs module‑by‑module tests for CPU, memory, storage and more. The app posts data to an online reference so you can see how each component fares against similar systems.
UserBenchmark to compare your hardware with similar systems
UserBenchmark runs a quick suite and opens a web report. The results rank your PC among thousands and show common upgrade combos. It’s fast and useful for spotting typical hardware bottlenecks.
- Use Sandra for deep diagnostics; use UserBenchmark for rapid comparison and upgrade ideas.
- Cross‑check the index with these tools to confirm which subscore truly needs fixing.
- Keep results from each run to track changes after a CPU swap, added storage, or faster RAM.
| Tool | Best for | Output | Use case |
|---|---|---|---|
| SiSoftware Sandra | In‑depth component tests | Detailed metrics + online comparisons | Validate upgrades and diagnose faults |
| UserBenchmark | Quick comparative ranking | Web report with typical combos | Find common upgrade paths |
| WEI baseline | Fast system snapshot | Single base index + subscores | Spot the weakest component |
Conclusion
Conclude by treating the index as a fast snapshot that highlights the weakest part of the system. Run winsat formal, read a clean summary in PowerShell, or open the Performance Monitor report. Find the XML at C:WindowsPerformanceWinSATDataStore for raw details.
Focus on the base and subscores to pick the right upgrade—storage, RAM, graphics, or CPU. Save results so you can compare before and after changes and confirm your wei score improves.
If you want a friendly interface, try ChrisPC or Winaero. For deeper comparisons, run SiSoftware Sandra or UserBenchmark. Repeat these quick checks regularly to keep performance steady across your computers.
FAQ
How do I run WinSAT from Command Prompt to generate the WEI?
Open Command Prompt as an administrator, type winsat formal and press Enter. The tool runs a series of tests for CPU, RAM, graphics, gaming graphics, and disk. Results are saved to the PerformanceWinSATDataStore folder for later review.
Can I get a cleaner WEI output using PowerShell?
Yes. Open PowerShell as admin and run Get-CimInstance Win32_WinSAT. This returns the base score and component subscores in a readable format without parsing XML files.
Where are the WEI XML results stored?
You’ll find the detailed XML reports in C:WindowsPerformanceWinSATDataStore. Look for files named by date with “formal” in the filename to see the most recent assessment data.
How can I view scores with Performance Monitor or System Diagnostics?
Run the System Diagnostics tool or open Performance Monitor and add the WinSAT performance counters. These tools show real-time metrics and let you correlate subscores with system behavior during tests.
Are there third-party tools that restore the visual WEI interface?
Yes. Tools like ChrisPC Win Experience Index and Winaero WEI Tool recreate a friendly on-screen score display for modern systems, letting you capture screenshots and share results easily.
What does the base score represent and how is it calculated?
The base score equals the lowest subscore among CPU, memory, graphics, gaming graphics, and disk. That lowest value often signals the system’s bottleneck for balanced performance.
How should I interpret individual subscores for CPU, RAM, and disk?
Each subscore reflects a component’s capability for common tasks. Higher CPU and RAM scores help multitasking and web browsing. Strong disk scores, especially with SSDs, cut boot and load times. Graphics and gaming graphics show display and game performance.
What do the numeric score ranges mean for everyday use?
Scores typically range from 1.0 to 9.9. Values above 6.0 handle most productivity, web, and media tasks smoothly. Scores under 4.0 may struggle with modern applications, while 8.0+ suits demanding creative work or gaming.
How do I spot and fix bottlenecks that lower the base score?
Check all subscores and identify the lowest one. Common fixes include upgrading to an SSD for slow disk scores, adding RAM for memory limits, or installing a better GPU for graphics shortfalls.
Are there alternatives to WEI for deeper benchmarking?
Yes. SiSoftware Sandra offers detailed component-level analysis and comparisons. UserBenchmark provides quick comparative results versus similar systems, highlighting weak spots and upgrade impact.
Will running these assessments harm my system?
No. WinSAT, PowerShell queries, and third-party benchmarking tools run at normal user-level stress and are safe. Close other apps during tests to get accurate results and avoid interference.