
Runtime broker is a built-in Windows process that links Microsoft Store apps to your privacy and permissions choices. It debuted with Windows 8 and remains a small but important part of the system on Windows 10 and Windows 11.
- What Is Runtime Broker
- Definition: The process that brokers app permissions
- How it works with universal and store apps
- When you’ll notice it
- Find Runtime Broker in Task Manager and Verify File Location
- Why Runtime Broker Uses Memory and CPU
- How to Safely Reduce Runtime Broker CPU or Memory Usage
- Security and Privacy: Is Runtime Broker a Virus?
- Conclusion
- FAQ
- What is the purpose of the process that manages app permissions on my PC?
- Can you define the Windows process that handles app permissions?
- How does this service work with Store apps, trust, and privacy settings?
- When will I notice it activate — during background tasks or at app launch?
- How do I find the process in Task Manager and confirm its file location?
- What are normal RAM and CPU ranges shown in Task Manager?
- Why does it sometimes use more memory or CPU than expected?
- How can I safely reduce its CPU or memory usage?
- Is it safe to end the task or disable the broker process permanently?
- Could the process be a virus or malware?
- How can I tell if an app is causing repeated spikes?
The task runs quietly most of the time, using about 20–40 MB of memory and almost no CPU when idle. You may see brief spikes to higher CPU and memory when you open a universal app; that is normal and temporary.
This process helps enforce app permissions like access to location or the microphone, so apps only use features you allow. That design preserves user trust and protects privacy while apps run.
If it ever uses unusually high CPU or memory for a long time, you can end the task in Task Manager; Windows will restart it automatically. Later in this guide, you’ll learn how to find the process, confirm it’s legitimate, and safely reduce resource use.
What Is Runtime Broker
A background Windows process acts as the gatekeeper for app permission requests. The runtime broker checks that each Microsoft Store or UWP program declares permissions before it uses features like location or the microphone.
Definition: The process that brokers app permissions
The broker enforces your privacy and trust settings. It only lets an app access hardware or data if you or the system allowed that action.
How it works with universal and store apps
When a universal app requests access to photos, camera, or location, the broker verifies the declared permissions and responds quickly. Developers rely on this consistent check to keep permissions predictable.
When you’ll notice it
The process runs in the background most of the time. You’ll typically see momentary spikes in cpu usage when a universal app launches or asks for a permission. That brief activity is normal and expected.
- Originated with metro apps in Windows 8 and continues in modern Windows.
- Helps protect privacy by enforcing settings at request time.
Find Runtime Broker in Task Manager and Verify File Location
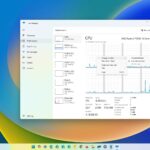
Begin by launching Task Manager so you can observe cpu and memory usage live. Look under Processes or the Details tab to locate the runtime broker entry and its current resource use.
Open File Location
Right-click the process and choose Open file location. Make sure the executable path points to C:WindowsSystem32runtimebroker.exe. If the file location is outside System32 or in a user folder, treat that as a red flag and investigate with security tools.
Normal usage benchmarks
Typical idle memory sits around 20–40 MB. When a universal app launches, ram may rise to roughly 500–700 MB. CPU usage stays near 0% at rest and may spike to 25–30% briefly during app start, then settle back down.
- Open Task Manager to view real-time cpu usage and memory for the process.
- Use the Performance tab to check total ram and watch how memory changes when apps open or close.
- View processes for all users if you don’t see the entry initially.
- If multiple entries appear, verify each file path in System32 to make sure they are legitimate.
Why Runtime Broker Uses Memory and CPU
Most of the time this system helper uses minimal resources, then briefly ramps up when apps need checks. That pattern explains normal behavior and helps you spot unusual usage.
Normal idle behavior: At rest the process often sits at about 20–40 MB of memory with cpu near 0%. It runs in the background and waits for permission requests from apps.
Spikes when you launch universal app
When you open a universal app, memory can climb to roughly 500–700 MB and cpu usage may jump near 25–30% while permissions are verified. These spikes happen at the moment of launch and usually drop as the app stabilizes.
- The process keeps some data in memory to speed later checks, so short-lived elevated memory is normal.
- Repeated spikes each time you launch universal apps are expected and do not harm long-term performance.
- Persistent high usage or steadily rising memory suggests a misbehaving app or a Windows feature triggering activity.
| State | Memory | CPU | Action |
|---|---|---|---|
| Idle (normal) | 20–40 MB | ~0% | No action needed; monitor baseline |
| At launch (expected) | 500–700 MB | Up to 25–30% | Wait for app to stabilize |
| Persistent high usage | Steady growth | Ongoing >10% | Check recently opened app; see next section for fixes |
| Background UWP activity | Variable | Short bursts | Review UWP-powered features and tips |
Track patterns in Task Manager over time and note which app opened when a spike occurred. That makes it easy to confirm normal operation or find a culprit for remediation.
How to Safely Reduce Runtime Broker CPU or Memory Usage
Reducing excessive cpu and memory use usually starts with a few simple settings tweaks in Windows. Try one change at a time and test usage so you can see what helps.
Turn off tips: Open Settings > System > Notifications & actions and toggle off “Get tips, tricks, and suggestions as you use Windows.” This option can trigger extra background checks and raise cpu usage.
Fix problem apps: If an app causes steady high usage, update it first. If that fails, reinstall or remove the app to resolve the issue.
- Limit apps running in the background: Settings > Privacy > Background apps — toggle off items you don’t need.
- Use Task Manager to end runaway processes: right-click the entry and choose End Task. Windows will restart the process cleanly.
- Make sure to save work before ending tasks, and consider a quick restart to clear lingering memory holds.
Final note: Do not disable the runtime broker process permanently. The broker process helps Store apps and protects privacy, so keep it enabled and adjust settings instead of removing core system features.
Security and Privacy: Is Runtime Broker a Virus?
A quick security check can confirm that this system helper is a legitimate Windows component and not a threat. The genuine executable lives at C:WindowsSystem32runtimebroker.exe. Use Task Manager, right-click the process, and choose Open file location to verify the file location.
File path check and multiple instances explained
Seeing more than one process entry is usually normal. Modern Windows may spawn several instances to handle separate app tasks.
Still, make sure each entry points to the proper file path. If any instance opens from a non-system folder, treat that as suspicious and act.
- Make sure the path is C:WindowsSystem32 for authenticity.
- Multiple entries can be part of normal processes handling Store apps.
- If the open file location is outside System32, consider further checks.
Run a trusted antivirus scan for peace of mind
While it’s uncommon for malware to mimic this name, verification by path and signature is the most reliable first step. Run a full scan with reputable antivirus software and keep Windows updated so security patches stay current.
| Concern | Action | Why it helps |
|---|---|---|
| Unknown file location | Scan and quarantine | Detects tampering or virus |
| Multiple entries | Verify each path | Confirms legitimate multi-process behavior |
| AV alert or odd behavior | Quarantine, then re-check file | Prevents spread and pinpoints source |
For extra reading on legitimacy checks and behavior, see this guide: runtime broker checks and details.
Conclusion
Keep a few simple checks in mind to manage resource spikes without stress. The runtime broker is a legitimate Windows helper that protects privacy by vetting permissions for universal apps and metro apps.
Normal behavior shows low memory (about 20–40 MB) with short spikes to 500–700 MB and brief cpu jumps when you launch universal app instances. Minor bursts are expected; sustained high usage is the real problem.
Use Task Manager to watch usage, end the process if needed, and confirm the file location in System32. Disable tips, limit background apps, and update or remove any misbehaving app as the easiest fixes.
Check microphone and location permissions in settings, run an antivirus scan if a path looks wrong, and review startup apps now and then. Understand, verify, and tune — most issues are easy to manage once you know where to look.
FAQ
What is the purpose of the process that manages app permissions on my PC?
That Windows system process brokers permission requests from Microsoft Store apps, helping control access to camera, microphone, location, and other resources. It runs when a Universal app asks for rights or when background tasks need verification, keeping trust and privacy settings enforced without exposing apps directly to system resources.
Can you define the Windows process that handles app permissions?
It’s a built-in system process responsible for mediating between installed apps and sensitive system features. It ensures apps only use capabilities you’ve allowed in Settings, acting as a lightweight middleman so each app can’t access files, devices, or sensors without confirmation.
How does this service work with Store apps, trust, and privacy settings?
When a Store app requests access to camera, microphone, location, or files, the process checks your privacy choices and grants or denies permission. It respects per-app settings in the Privacy section of Windows Settings and helps prevent persistent background access unless you’ve allowed it.
When will I notice it activate — during background tasks or at app launch?
You’ll typically see it start when you open a Universal app or when a background task triggers. It spins up briefly for permission checks and often stays idle, but it may run longer if an app performs ongoing actions that require repeated verification.
How do I find the process in Task Manager and confirm its file location?
Open Task Manager, look for the process name in the Processes tab. Right-click it and choose “Open file location” — the legitimate executable lives in C:WindowsSystem32runtimebroker.exe. That confirms the system copy; any other location is suspicious.
What are normal RAM and CPU ranges shown in Task Manager?
Under normal conditions it uses minimal RAM, often under 50–100 MB, and near-zero CPU when idle. Small, brief CPU spikes are common when apps launch. Sustained high usage is unusual and indicates an app or setting causing extra work.
Why does it sometimes use more memory or CPU than expected?
Increased usage usually happens while launching Universal apps or when apps repeatedly query permissions. A buggy or misbehaving app that keeps requesting resources can cause higher memory and CPU until the app stops or you change its settings.
How can I safely reduce its CPU or memory usage?
Start by turning off “Get tips, tricks, and suggestions” in Settings > System > Notifications & actions. Update, reinstall, or remove any apps that misbehave. Limit background app activity via Settings > Privacy > Background apps. If needed, end the task in Task Manager and restart Windows to clear transient issues.
Is it safe to end the task or disable the broker process permanently?
Ending the task is safe temporarily; Windows will restart the service when needed. Do not try to permanently disable it — it’s integral to permission handling and system security. Disabling it risks breaking Store apps and reducing privacy protections.
Could the process be a virus or malware?
The legitimate executable resides in C:WindowsSystem32. Multiple instances are normal when several apps run. If you find a duplicate in another folder, or the process shows unusually high resource use, run a full scan with Windows Defender or another trusted antivirus for peace of mind.
How can I tell if an app is causing repeated spikes?
Use Task Manager’s Details or Resource Monitor to see which app correlates with the spikes. Check app permissions in Settings and disable background access or reinstall the app. Updating Windows and the app often fixes repeated permission checks or leaks.